0-9
4 P
Refers to a pyramid with four layers describing the Toyota Way:
- Philosophy
- Process
- People and Partners
- Problem Solving.
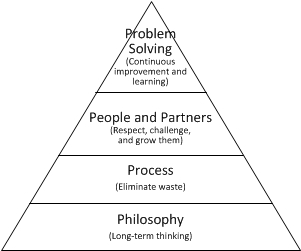
References: Liker, J.K. (2003). The Toyota Way: 14 Management Principles from the World’s Greatest Manufacturer. McGraw-Hill, 362 pp. Liker, J.K. and Meier, D. (2005). The Toyota Way Fieldbook: A Practical Guide for Implementing Toyota’s 4Ps. New York: McGraw-Hill, 476 pp.
5 Big Ideas
→ see Five Big Ideas
5 S
A disciplined approach to maintaining order in the workplace, using visual controls, to avoid and eliminate waste. English translations from Japanese of the 5 S words are:
- Sort
- Straighten or Set in Order
- Shine or Sweep
- Standardize
- Sustain or Self-Discipline.
5 WHYs, 5 Why analysis
A problem solving technique based on asking why successively (at least 5 times) in order to get beyond the symptoms of a problem and to uncover the root cause. Reference: For a definition, also see p. 17 in Ohno, T. (1988). The Toyota Production System: Beyond Large-Scale Production. Productivity Press, Portland, OR, 143 pp.
7 wastes
Ohno (1988) defined seven wastes in production:
- Defects
- Inventory
- Processing or Over Processing
- Waiting
- Motion
- Transportation or Conveyance
- Overproduction
Womack added
- Not using people’s capabilities
Koskela (2004) added
- Make-do
→ related to Muda
References:
Koskela, L. (2004). “Making-do: the Eighth Category of Waste.” In: Bertelsen, S. and Formoso, C.T., Proc. 12th Annual Conference of the International Group for Lean Construction, Helsingør, Denmark, 3-5 Aug.
Ohno, T. (1988). The Toyota Production System: Beyond Large-Scale Production. Productivity Press, Portland, OR, 143 p.
A
A3, A3 thinking
A report prepared on a single sheet of paper (size 297 mm × 420 mm or approximately 11” x 17”) that adheres to the discipline of PDCA thinking as applied to problem solving that is called “A3 thinking.”
The problem solving A3 includes the background, problem statement, analysis, proposed corrective actions (and the action plan), and the expected results, often with graphics. A3 reports can be used as a standard method for summarizing problem solving efforts (e.g., analysis of Target Value Design options), status reports, and planning exercises.
Reference: Shook, J. (2008). Managing to Learn: Using the A3 Management Process to Solve Problems, Gain Agreement, Mentor and Lead. Lean Enterprise Institute, Boston, MA.
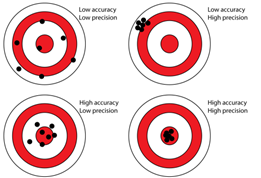
accuracy
How close the actual value of a quantity is to its specification (as distinct from precision).
→ related to predictability
Example: The painter’s duration estimate of 7 days plus-or-minus 2 days was accurate though not very precise: it took 8.5 days.
action research
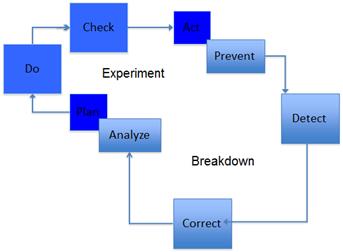
Research that follows a progression of PDCA cycles while engaging in real world processes (rather than conducting isolated laboratory experiments).
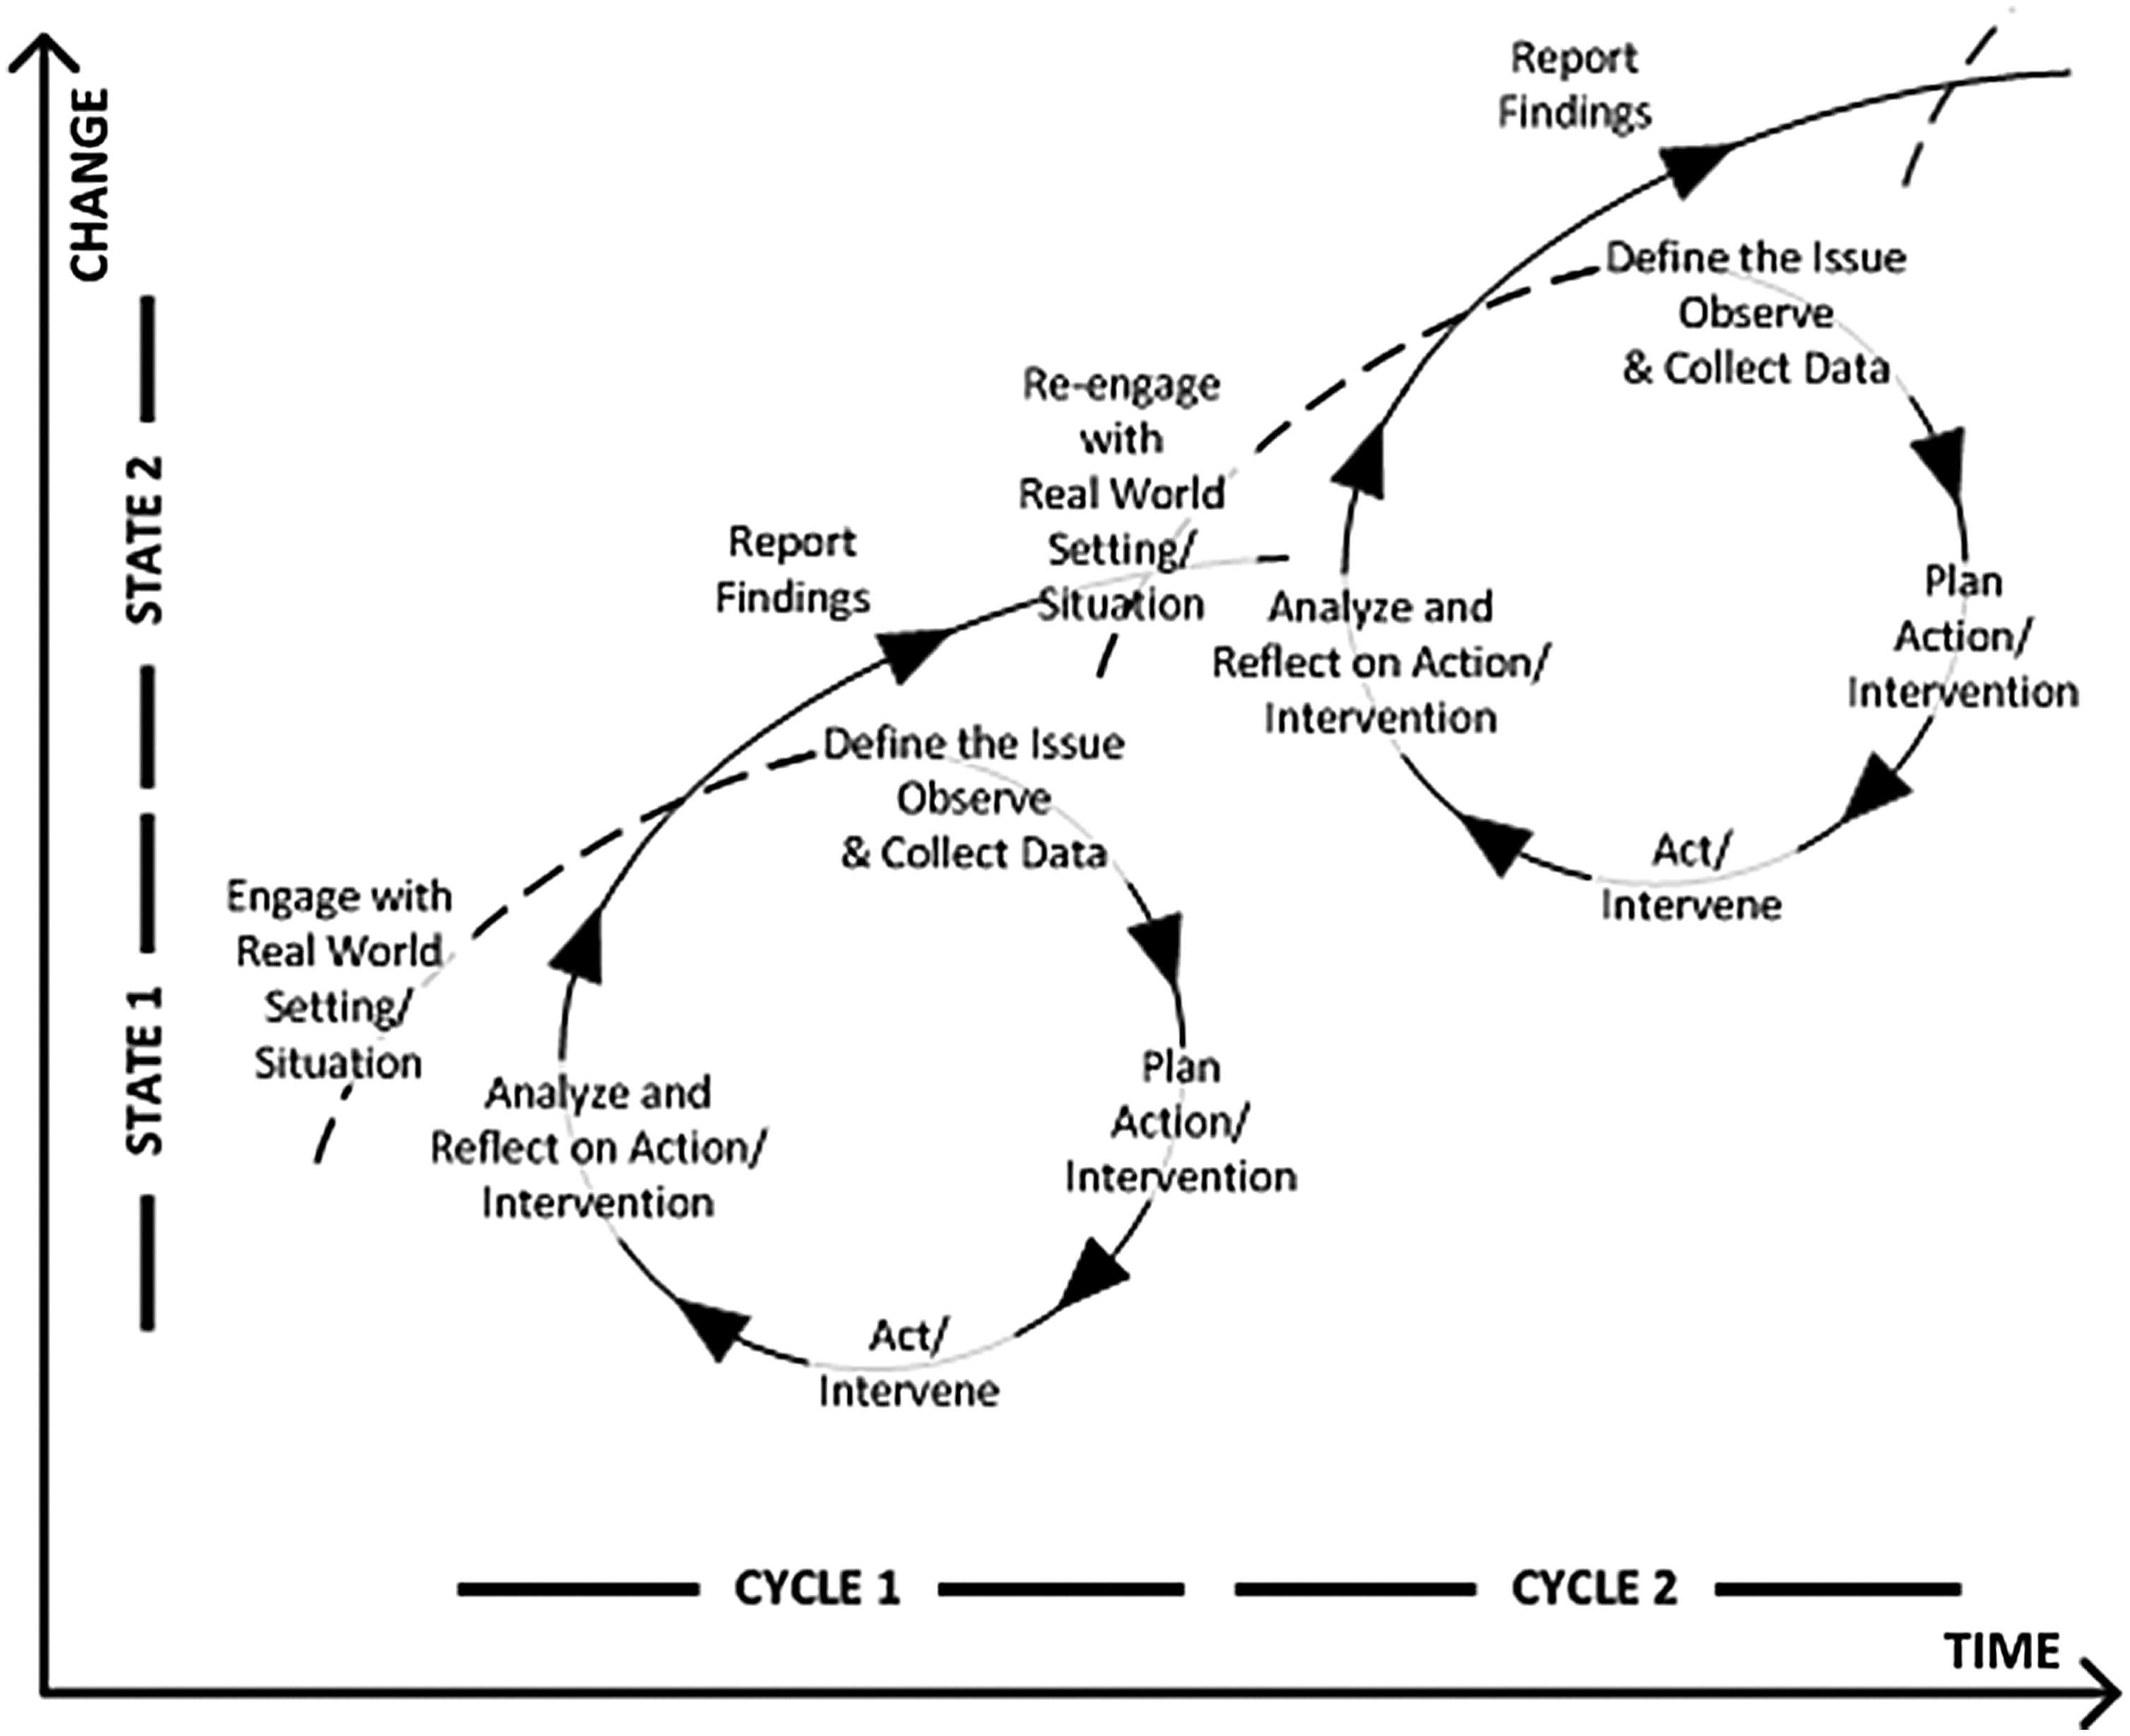
Source: Action research cycle (adapted by Iris Tommelein from image posted on www.brighthub.com)
The process starts with defining the issue by conducting initial observations and collecting existing data, then planning an intervention, then intervening, and ultimately analyzing and reflecting on that intervention as well as reporting out; it gets repeated over and over.
activity
The taking of an action.
In the context of production management, action is taken in order to achieve an end such as achieving a recognizable state of completion or meeting a condition of satisfaction (as opposed, e.g., to reacting to some occurrence).
Activity is a general term used to avoid the specificity of, for example, use of the word task or step for example in the Last Planner System.
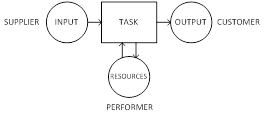
Activity Definition Model (ADM)
An input-process-output representation of work to be done in design or construction. The model depicts the specification of directives (entering the process rectangle from above), prerequisites (including materials and information to be transformed into the desired output, entering the process rectangle from the left), and resources (entering the process rectangle from below). It also shows an inspection process resulting either in redo or release to the customer process. The model is used as a guide to exploding scheduled tasks into a level of detail at which their readiness for execution can be assessed and advanced.
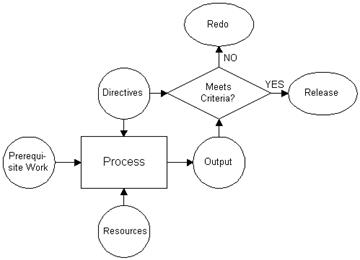
Image source: Jerry Talley
activity-on-arrow diagram (AOA)
Network drawn to support computations using PERT. It shows activities as arrows, delimited by event nodes.
This notation convention is the inverse of the activity-on-node diagram that is used in the Critical Path Method (CPM).
activity-on-node diagram (AON)
Network drawn to support computations using the Critical Path Method (CPM). It shows activities by means of nodes and precedence relationships by means of arrows.
This notation convention is the inverse of the activity-on-arrow diagram that is used in PERT.
Actual Cost (AC) [TVD]
The documented amount of money spent to actually perform work (an activity, chunk of work, or an entire project) based on the agreed definitions of cost, overhead, and profit.
ADM
→ see Activity Definition Model
advantage [CBA]
In the context of Choosing by Advantages, an advantage is the beneficial difference between attributes of two alternatives, one of which is the least preferred when assessed according to a certain criterion (after Suhr 1999).
Allowable Cost (AC) [TVD]
In Target Value Design, what an owner is willing and able to pay in order to get what they want, in other words, what that product or asset is worth to them.
alternative [CBA]
In the context of Choosing by Advantages, two or more people, things, or plans from which one is to be chosen (Suhr 1999).
anchoring [CBA]
In the context of Choosing by Advantages, the practice of basing decisions, attributes, and importance on (anchored to) relevant factual data (Suhr 1999).
andon
Signal given by a production unit to alert others of the occurrence of a deviation from the standard and to possibly call for immediate help so that a countermeasure can be implemented without exceeding the Takt time and having to stop the assembly line.
Assembled To Order (ATO)
Product put together from parts that are already designed and made so as to meet the specifics of a customer request (order).
One category in a classification that distinguishes how long a product or service remains generic vs. becomes customer specific in its production.
One approach for mass customization, whereby parts may have been produced in volume based on forecast.
→ related to ETO, FTO, MTO, MTS, and CODP

Source: Iris D. Tommelein
assignment [LPS]
A request made to and accepted by a worker or workers (production unit) directly or indirectly producing (designing and making) something or offering a service.
In the Last Planner System, a request or offer that meets the quality criteria and has resulted in a reliable promise, ready to be placed on the Weekly Work Plan for performance.
Example: Scott, you and Julie are to make the changes in wall locations detailed in memo #123 by the end of the week. Anne, you find out what the building authorities will require for a structural permit.
ATO
→ see Assembled To Order
attribute [CBA]
In the context of Choosing by Advantages, a characteristic, quantity, or quality of one alternative (Suhr 1999).
autonomation
“Intelligent automation” or “automation with a human touch” whereby a machine is made not only to fulfill its production function, but also to perform quality control functions, namely detect defects and automatically stop.
Autonomation helps to implement the jidoka principle (and pillar) in the Toyota Production System.
B
backlog
In planning → see workable backlog
backward pass calculation [CPM]
Calculation of the late finish date and late start date of an activity in a network, taking into account the activity precedence relationships, by starting from the end of the schedule.
(to) balance
Matching load to capacity. Matching demand with supply.
batch
The number of units that are being worked on simultaneously before a process produces output (production batch) or the number of units that together are being handed off from one production unit to the next (transfer batch).
A goal of lean is to achieve single-piece flow, that is, use batches of size 1 (1 being the unit the customer wants).
(to) batch
The practice of creating a batch or batches.
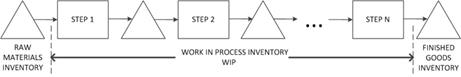
batch flow
Production system whereby processing stations (machines) are laid out by functional grouping so that each unit being produced is likely to have to follow a jumbled flow from one to the next, according to the processing steps it requires.
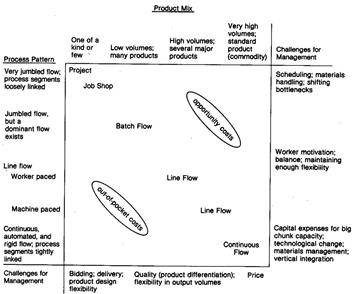
Figure source: Schmenner (1993)
Reference: Schmenner, R. W. (1993). Production/operations management: from the inside out. Macmillan College.
Big Room, Oba, Obeeya
A designated place for a team to co-locate, engage in collaborative problem solving, and maintain a visual workplace.
BIM
→ see Building Information Model(-ing)
BIQ
→ see Built-in Quality
bottleneck
The production unit with the lowest throughput (longest cycle time) of all production units in a system (the choke point) that is linear, sequential, and deterministic.
In other systems, bottlenecks also exist but they may be harder to pinpoint. Moreover, due to the possible inter-relatedness of parts and dynamic, stochastic characteristics of a system, its bottleneck(s) may shift over time.
breakdown
Deviation from standard process or target outcome(s).
Types of breakdowns:
- Near misses, accidents, injuries
- Errors, defects, rework
- Broken promises, plan failures
Breakdowns provide learning opportunities because either
- we did not properly perform process A and need to learn how to do so, or
- our knowledge regarding causality “IF A THEN B” is inadequate.
broken promise → also see reliable promise
plan failure → also see quality criteria [LPS]
buffer
A mechanism for deadening the force of a concussion; e.g., a capacity buffer is created by scheduling less than all the time available (aka. underloading the production unit or other resource). If production falls behind schedule, there is capacity available for catching up. Capacity buffers may be preferred over inventory buffers. In addition to capacity and inventory buffers, other types of buffers are time buffers, monetary buffers (contingency), and spatial buffers (tolerances or allowable dimensional variation). Arguably, monetary buffers can be converted into, e.g., capacity buffers or inventory buffers.
A decoupling buffer is a kind of inventory buffer in-between two processes, large enough and replenished so that the second process can proceed at its own pace without being held up by the first.
buffer management
The selection, location, and sizing of buffer types within a production system in order to absorb variations in that system. It can include the modification of one or several of those selections as the project moves through time.
For example, buffers may be constrained (limited to a maximum size) by implementing pull using kanban or CONWIP.
Building Information Model(-ing) (BIM)
The process of generating and managing building data during the life cycle of a building.
The system comprising an integrated database, one output of which is a 3-dimensional model. 3D BIM refers to the 3-dimensional geometrical model, including spatial relationships, geographic information, and non-spatial properties of building components and systems. 4D also includes time so it may allow for simulation of the building assembly process. 5D further includes cost data so it may allow for cost modeling. 6D refers to a BIM annotated with data so it may support facility life-cycle management.
Built-in Quality (BiQ)
Quality achieved by work structuring, including designing operations so as to meet customer requirements, removing constraints, preparing workers, mistakeproofing and performing successive inspection during each processing step, as well as at each handoff; i.e., designing and executing the processes of making things so those products conform to requirements.
BiQ aims to avoid the reliance on end-of-line inspection and correction to achieve conformance to requirements.
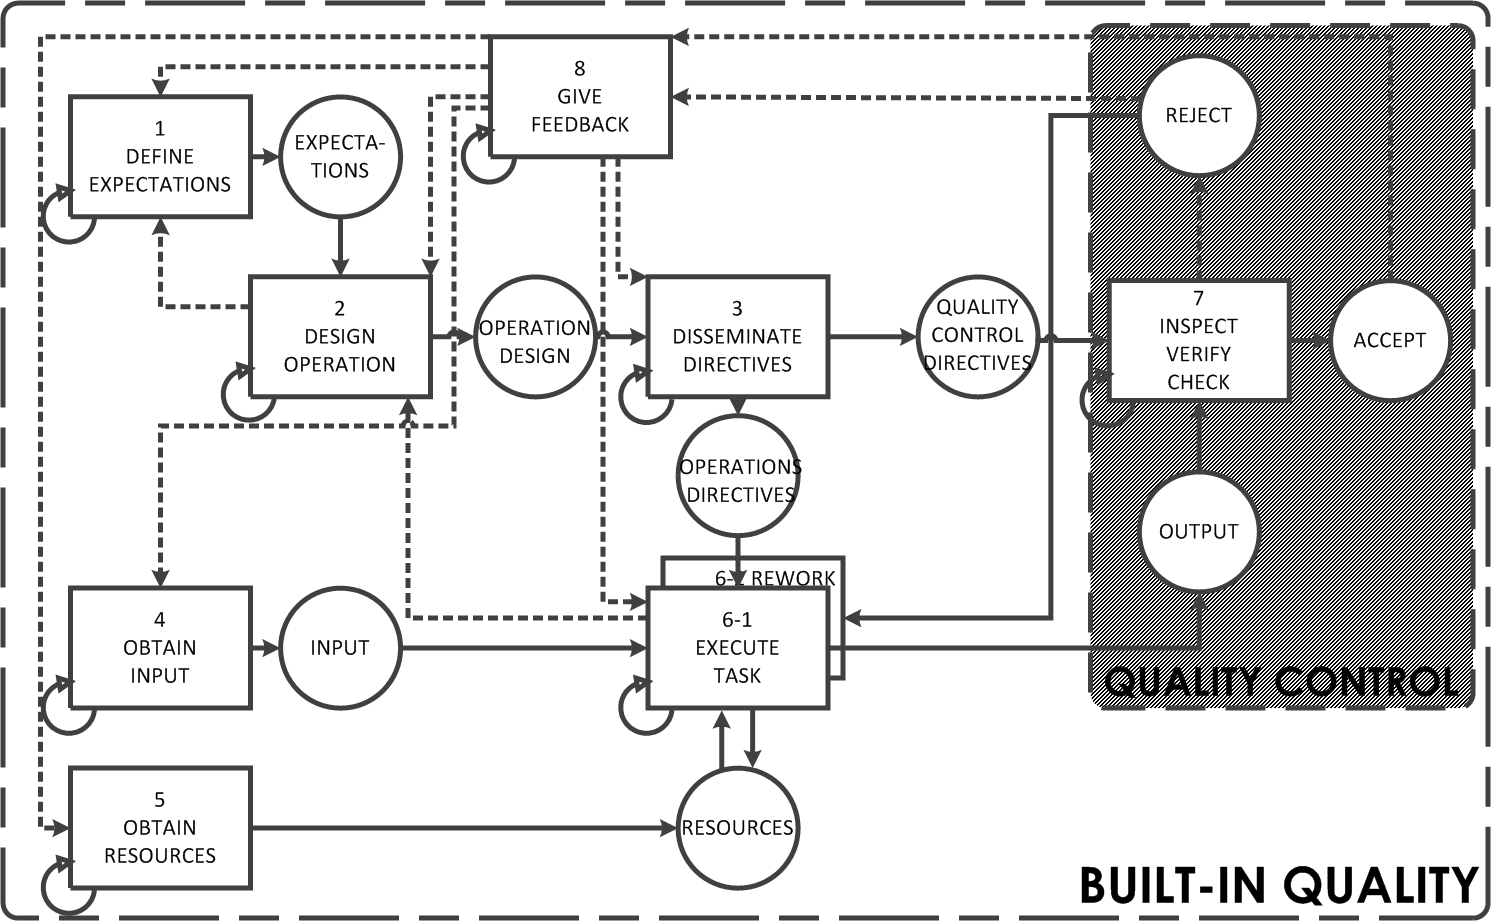
Figure source: (c) 2015, Iris D. Tommelein
C
capacity
[units of work/unit of time] The amount of work a production unit, whether individual or group or a machine, can accomplish in a given amount of time in given conditions.
Example: Jim the engineer can perform 10 piping stress analyses per day on average, but the analyses to be done this week are particularly difficult. He will only be able to do 7. That is, Jim’s average capacity is 10, but his capacity for the specific work to be done this week is 7.
cause-and-effect diagram, fishbone diagram, Ishikawa diagram
Graphical representation of causes and effects laid out so as to mimic the bones of a fish. Named after Kaoru Ishikawa (1915-1989). 
Figure source: http://upload.wikimedia.org/wikipedia/commons/5/52/Ishikawa_Fishbone_Diagram.svg visited 6 NOV 2014
CBA
→ see Choosing by Advantages
CBA Process for Complex Decisions [CBA]
Decisionmaking process articulated by Jim Suhr (1999) comprising five phases:
I. The Stage-Setting Phase
II. The Innovation Phase
III. The Decisionmaking Phase
IV. The Reconsideration Phase
V. The Implementation Phase
Reference: Suhr, J. (1999). The Choosing By Advantages Decisionmaking System. Quorum, Westport, CT, 293 pp.
(to) change over, changeover
Setup or adjustment required to a process, machine, layout, etc. when one is done making one kind of product, in order to be able to start making another kind of product. → related to (production) batch
Choosing by Advantages [CBA]
System for sound decisionmaking formalized by Jim Suhr (1999).
Reference: Suhr, J. (1999). The Choosing By Advantages Decisionmaking System. Quorum, Westport, CT, 293 pp.
CODP
→ see Customer Order Decoupling Point
commitment plan [LPS]
Output of commitment planning. A Weekly Work Plan is a commitment plan done weekly. (Arguably, planning at any level involves making commitments.) → see reliable promise
commitment planning, commitment-based planning [LPS]
A planning system that is based on making and securing reliable promises in a public setting. The process in the planning system hierarchy, below make-ready planning (lookahead planning), that results in production units making commitments to deliver on which others in the production system can rely because they follow the rule that only defined, sound, sequenced and sized assignments are to be accepted or made. Commitment planning done on a daily/weekly basis is called Daily/Weekly Work Planning. Tasks in commitment plans are expressed in terms of steps in operations. The commitment is made to completing the operation.
Example: On my work plan for next week, I have included providing Cheryl the soils data she needs to evaluate alternative substructure systems for the building. All known constraints have been removed from my task, I understand what is required and how the information will be used, and I have reserved needed labor and equipment.
commodity material
Material made by different manufacturers but more-or-less indistinguishably from one to the other, thereby allowing for substitution or interchangeability. Also, material that is supplied and replenished in bulk quantity, for which no piecemeal quantity take-off is done.
Example: This box contains one pound of 3” wire nails.
Community of Practice (COP)
A group of people who share a concern or a passion for something they do and learn how to do it better as they interact regularly. Reference: Wenger-Trayner and Wenger-Trayner (2015). “Communities of practice: A brief introduction.” April 15, http://wenger-trayner.com/wp-content/uploads/2015/04/07, Brief-introduction-to-communities-of-practice.pdf visited 10 JAN 2016.
complex
Not simple, nor complicated. Snowden describes that in the complex domain, cause-effect relationships are not a priori known.
→ as distinct from simple or complicated
Reference: Snowden, D.J. and Boone, M.E. (2007). “A Leader’s Framework for Decision Making.” Harvard Business Review, Nov., 69-76.
complicated
Not simple, nor complex. Snowden describes that in the complicated domain, cause-effect relationships (1) exist, (2) there is a right answer, but it is not so self-evident and therefore requires expertise. One can use an analytical model or call in experts who built expertise in that domain, who can make the right decision. In the complicated domain, experts apply good practice (not best practice). There are several ways of doing things, all of which legitimate, if you have the right expertise. You’ll tick people off, by forcing them to adopt one practice, if they want to use another practice. → as distinct from simple or complex Reference: Snowden, D.J. and Boone, M.E. (2007). “A Leader’s Framework for Decision Making.” Harvard Business Review, Nov., 69-76.
Condition of Satisfaction (COS)
Directive (proactive: for steering) and criterion (reactive: for judging), imposed by the entity initiating a process (usually the customer) that specify (to the performer of that process) how success of the outcome will be gauged. What will make a customer satisfied with the service or product received.
constraint
An input, directive, resource, or other requirement that will prevent a task or an assignment from starting, advancing, or completing as planned.
constraint [CBA]
Cause for an alternative to be excluded from consideration. In the context of Choosing by Advantages, a must criterion or money.
constraint [LPS]
In the context of the Last Planner System, something that stands in the way of a task being executable or sound. Typical constraints on design tasks are inputs from others, clarity of requirements criteria for what is to be produced or provided, approvals or releases, and labor or equipment resources. Typical constraints on construction tasks are the completion of design or prerequisite work; availability of materials, information, and directives. Screening tasks for readiness is assessing the status of their constraints. Removing constraints is making a task ready to be assigned.
constraint log
A list of constraints, each one with an identification of the individual who promised to remove it by an agreed-upon date. The log gets developed during the make-ready process in lookahead planning. Each individual who promises to remove a constraint can manage their constraint removal process by using their own Last Planner System.
contingency
Synonym for buffer but typically used in the sense of “financial contingency.” Amount of money budgeted to function as buffer against un-specifiable future costs.
continuous improvement
Repetition of the PDCA cycle.
continuous flow, continuous flow process
Production system with processes that have no buffers in-between processing steps.
Illustration → see batch flow

Example: After the concrete has been placed and vibrated, it begins to cure.
(to) control
To engage in activities designed to cause events to conform to plan (i.e., to provide the ability to steer), or to initiate replanning and learning.
Example: Exploding master schedule activities into greater detail, screening the resultant tasks against constraints, and acting to remove those constraints are all control actions intended to cause events to conform to plan, or to identify as early as practical the need for replanning. Learning is initiated through analysis of reasons for failing to cause events to conform to plan.
controls, project controls
High-level set of metrics and practices applied to assess whether or not project’s execution is progressing as planned (that is, producing expected outcomes); often retrospective by nature.
CONWIP
CONstrained Work In Process. A means to limit the amount of inventory in a production system.
COP
→ see Community of Practice
COS
→ see Condition of Satisfaction
cost modeling
The practice of keeping track of component- and system costs in the course of design, as may be done by means of 5D BIM.
countermeasure
Corrective action taken in response to the identification of a deviation from an expected outcome in an attempt to prevent that problem from occurring. Whether or not that attempt is successful will have to bear out.
CPM
→ see Critical Path Method
crew balance chart
Depiction of workers or production units with the tasks they are performing over time. The aim is to determine each person’s (unit’s) utilization and to divide work evenly. Note: crew balancing aims are optimizing the crew speed. This is local optimization as no consideration is given to the handoffs between this crew and others nor to production system design in general. 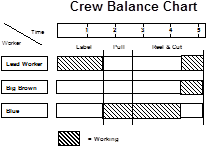
References: Howell, G., Laufer, A., and Ballard, G. (1993). “Interaction between Subcycles: One Key to Improved Methods.” ASCE, J. Constr. Eng. Manage., 119 (4) 714-728.
Oglesby, C.H., Parker, H.W., and Howell, G.A. (1989). Productivity Improvement in Construction. McGraw-Hill.
→ see the broader concept Takt Planning
criterion (in plural: criteria) [CBA]
In the context of Choosing by Advantages, a criterion is any standard on which a judgment is based (Suhr 1999). A criterion can be either a must criterion or a want criterion.
- Must Criterion: A standard that an alternative must meet or be excluded from consideration.
- Want Criterion: A standard that the stakeholders agree would be beneficial in varying degrees (e.g., expressing a preference).
A criterion can be qualitative or quantitative:
- Qualitative Criterion: A standard that expressed non-tangible value. It must be described in details that the stakeholders understand.
- Quantitative Criterion: A standard that can be measured objectively.
criterion (in plural: criteria) [LPS]
In the context of the Last Planner System, criteria are a subset of directives, specifically those used to evaluate process outputs.
Critical Path Method (CPM)
A method for computing the shortest duration of a network of activities, based on a duration estimate (deterministic number) for each activity and precedence relationships between them (e.g., finish-to-start relationships). The sequence of activities that defines this shortest duration is called the ‘critical path.’
→ related to float, forward pass, backward pass.
cross-functional diagram, multi-functional diagram, swimlane diagram
Illustration of work to be done by each party or team (each one in a single row or “lane”) involved in process, and of relationships or hand-offs between them.
current state map [VSM]
A value stream map that describes the existing (current, observed) situation.
customer
The direct or indirect user or beneficiary of one’s output. The person (production unit) who requests and sets the requirements for the handoff to be received from the performer. The individual engaged in a conversation for action who will receive the output or results of performance either requested from, or offered by, the performer. Example: John needs the results of our acoustical tests in order to select the best location for his mechanical equipment. John is our customer because he will use what we produce.
Customer Order Decoupling Point (CODP)
A point in the production system (supply chain) where requirements specific to an individual customer are applied to customize the product. At and downstream of that point, the product is therefore made based on demand. Upstream of that point, the product is made based on forecast. The location of the COPD affects the lead time. Illustration → see Assembled To Order → related to ETO, ATO, MTO, and MTS
customization
Making a product or service more unique, specifically in order to meet a customer’s conditions of satisfaction.
Cycle Time (CT) ∆
[unit of time] The time it takes a product, piece of information, or chunk of work (e.g., a room, building, quadrant) to go from beginning to end of a production process; that is, the time it is work-in-process [units of time]. It is the time for a product to transit the system and thus defined by how one defines the boundaries for that system. The cycle time is influenced by a number of production system design parameters:
CT = BT + MT + ST + PT + QT
where
BT = batch time MT = move time ST = setup or change over time PT = processing time QT = queue time
→ see work in process, Little’s Law, Kingman Formula
cycle time histogram [TP]
Synonym for Yamazumi chart or stacked bar chart.
see → stacked bar chart
D
decoupling buffer
→ see buffer
defect
An output that does not conform to a condition of satisfaction or specification; not to standard; not of quality. One of 7 wastes defined by Ohno (1988) referring to effort needed to address incorrect information, rework, and scrap.
defined, definition [LPS]
In the Last Planner System, a quality criterion for assignments that questions whether or not assignments are specific enough so that the right type and amount of information and materials can be collected, work can be coordinated with other disciplines or trades, and it is possible to tell at the end of an agreed-upon time period (e.g., a planning week) if the assignment has been completed. Assignments are ‘well defined’ when those who are to execute the assignment understand what work is to be done, where and when it is to be done, and can determine what materials and information is needed in order to do the work. When possible, assignments should be so defined that it is possible at the conclusion of the plan period to tell by looking if they were performed.
demand leveling, heijunka, production leveling
→ see load leveling
Deming Cycle
→ see PDCA Named after W. Edwards Deming (1900-1993) and based on work of Walter A. Shewhart (1891-1967).
dependence, interdependence
Defining a relationship between two or more activities, concepts, or things.
- Sequential dependence: one preceding the other, e.g., predecessor-successor relationship between activities where the first must be completed before the second can start.
- Reciprocal dependence: Where two or more activities are related so that one cannot be started (or finished) without a certain measure of progress or completion having been achieved by the other.
- Shared resource dependence: Where two or more activities require the same resource during their execution, e.g., two activities sharing a crane.
design
A type of goal-directed, reductive (not deductive) reasoning. There are always many possible designs, especially if one is willing to relax constraints (requirements). Product design reasons from function to form. Process design reasons from ends to means.
design criteria
The characteristics required for acceptance of product or process design. Example: The structural engineer needs both geometric and load inputs from the architect, mechanical engineer, and electrical engineer. Loads need only be accurate within 20%.
directive
Instruction or order issued by a Last Planner to direct workers (or production units) on what to do and possibly when or how to do it. Directives may apply to selection of prerequisites, resources, process execution, or criteria for output evaluation. → related to Activity Definition Model
E
earned value
An accounting method for project controls whereby partial credit is given to work completed, assessed based on an agreed-up schedule of values (earnings plan), with payments issued correspondingly.
This method is not lean: for example, it does not recognize the value of sequencing of work, creating specific handoffs, and shaping the work flow.
Reference: Kim, Y.-W. and Ballard, G. (2000). “Is the Earned-Value Method an Enemy of Workflow?” Proc. 8th Annual Conference of the International Group for Lean Construction (IGLC-8), Brighton, UK, 17-19 July.
Engineered To Order (ETO)
Product for which design and engineering are done in response to a specific request (order) from a customer, and that is then made to that design specification.
Illustration → see Assembled To Order
→ related to ATO, FTO, MTO, MTS, and CODP
ETO
→ see Engineered To Order
even flow production
Production with a steady throughput.
evenness of flow
Production achieved based on load leveling (heijunka).
Expected Cost (EC) [TVD]
In Target Value Design, an expression of the team’s best estimate at the conclusion of the validation phase of TVD of what current best practice would produce as a price for the facility reflected in the accompanying basis of design documents. Typically, the Expected Cost will also be supported by benchmarking or other market data so it is calibrated in light of the market context.
(to) expedite
Effort to shorten the duration of an activity from what is typical or originally offered.
When initiated as a result of a delay or lack of confidence that the original duration will be met, expediting means ensuring the delivery of services or goods according to the agreed-upon terms and conditions, meeting requirements of timeliness, quality, quantity, packaging, etc. It is a waste because the supplier is not trusted to have made a reliable promise to their customer.
(to) explode [LPS]
To express a task in greater detail, typically by producing a flow diagram of the process of which the output is the task being exploded, then determining the sub-tasks needed to make the task ready for assignment and execution when scheduled. Sub-tasks are categorized in terms of the activity definition model, resulting in actions to clarify or specify directives and requests for prerequisites from suppliers, and reservation of needed resources.
F
Fabricated To Order (FTO)
Product put together from parts that are already designed, but as-of-yet have to be made, so as to meet the specifics of a
customer request (order).
Illustration → see Assembled To Order
→ related to ETO, ATO, MTO, MTS, and CODP
fabrication
Process of customizing materials by means of cutting, drilling, fastening, welding, etc.
factor [CBA]
In the context of Choosing by Advantages, it is an element, part, or component of a decision (Suhr 1999). Some thought or thing that is given consideration in the decisionmaking process.
feedback
Information about the gap between the actual level and the reference level of a system parameter (input, process, or output) that is used to alter the gap in some way. The distinction between positive- and negative feedback is based on the consequence and not the action. If the action triggered by feedback widens the gap between the reference and the actual level(s) of the system parameter, the feedback is called positive feedback; if it narrows the gap, it is called negative feedback. Unpredictability of the action-consequence relationship makes the study of feedback difficult.
Reference: Ramaprasad, A. (1983). “On the Definition of Feedback.” Behavioral Science, 28:4-13.
FIFO
→ see first-in first-out
finished goods inventory
Inventory of goods (products or services) at the end of their production process, awaiting shipment or release to customers.
Illustration → see inventory
first-in first-out (FIFO)
Inventory management discipline whereby the items that first entered a waiting position (queue) are the first to be withdrawn from there.
first-run study (FRS) [LPS]
First (or one of several) trial execution(s) of an operation as a test of capability to meet safety, quality, time and cost targets. The FRS begins several (e.g., 2 or 3) weeks ahead of the first run with a planning session in which the team that will do that work is involved in developing a detailed work plan at the step level of task breakdown, so each person on the team knows what they are to do. First run studies follow the plan-do-check-act cycle. The plan is developed, the first run is carried out, the results are checked against the targets. If the results are inadequate, the operation design is replanned and the test performed again. This continues until the operation is considered capable, then that way of doing that type of work is declared the standard to meet or beat. First-run studies are done ahead of the scheduled first start of the operation, while there is time to acquire different or additional prerequisites and resources. First run studies are one of three ways in which operations can be designed: the other two are virtual prototyping (virtual first run studies or VFRS) and physical prototyping (mock ups).
fishbone diagram, Ishikawa diagram
→ see cause-and-effect-diagram
Five Big Ideas & Emergent Outcomes
A set of organizing concepts that support Lean Project Delivery, developed to explain and organize the Sutter Health Lean Construction Initiative launched in the early 2000s.
The Five Big Ideas are:
- Collaborate, Really Collaborate (originally implied “specialty contractors involved at schematic design”),
- Optimize The Whole,
- Tightly Couple Learning with Action,
- Projects as Networks of Commitment, and
- Increase Relatedness.
The Emergent Outcomes are:
- Innovation,
- Competitive,
- Continuous Improvement,
- Reliability, and
- Build Trust.
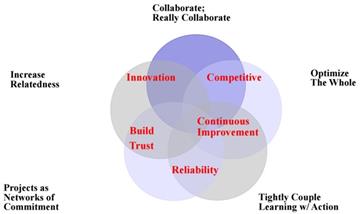
Figure source: http://www.leanproject.com/wp-content/uploads/Putting-the-Five-Big-Ideas-to-Work-LPC.pdf
float [CPM]
Calculation of the difference between late start vs. early start of an activity, reflecting the amount of time by which an activity can be delayed without delaying the early finish time of the project.
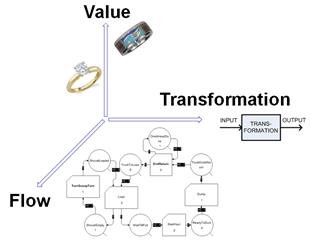
flow
→ see work flow
In general, refers to the F of Flow in the Transformation-Flow-Value (TFV) theory of production articulated by Koskela (1992, 2000).
(to) forecast
Prediction about the likelihood of occurrence of future events or performance.
forward pass calculation [CPM]
Calculation of the early start date and the early finish date of each activity in a network, taking into account the activity precedence relationships, by starting at the beginning of the schedule.
front end planning
The top level in the planning system hierarchy, above lookahead planning, dedicated to articulating high-level activities and their duration and sequencing as well as identifying milestones for an entire project, and resulting in a master schedule.
FTO
→ see Fabricated To Order
future state map [VSM]
A value stream map that describes a desired new (future) situation.
G
GANTT chart
Representation of a schedule, using a horizontal rectangle (bar) for each activity with the bar length scaled to match the activity duration, with activities placed one below the other and time on the horizontal axis.
gemba
The Japanese term referring to the location where value is added or the “work face,” e.g., the design office, fabrication shop, or on-site final assembly area. The lean practice of “going to the gemba” or “conducting a gemba walk “is for individuals to conduct first-hand observations (“go see for yourself”) rather than taking for granted abstractions of a situation seen and described by others.
genchi gembutsu
The Japanese term referring to “going to the gemba.”
H
(to) hand off
The act of releasing an output from a step or operation to the customer or production unit performing the next step or operation. Example: A structural steel design is “handed off” by the engineer to the steel detailer to complete shop drawings, a room that has been framed is “handed off” by the framer to the drywall installer, or all construction on a floor of a hospital is completed and it is “handed off” to the hospital personnel to begin “staff and stock” activities.
hand-off criteria
The criteria spelled out as conditions of satisfaction discussed and explicitly agreed upon between the provider and the customer (i.e., the parties to a hand-off).
hansei
The Japanese term meaning reflection, a means to learn from observation of a current situation, an experiment, a breakdown, etc.
heijunka, demand leveling, production leveling
→ see load leveling
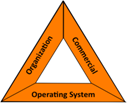
House of Toyota
Representation of the fundamental building blocks that make up the Toyota Production System. 
Source: after http://michelbaudin.com/2013/03/29/lean-is-from-toyota-not-ford-and-not-15th-century-venice-boat-builders/ visited 16 MAR 2015


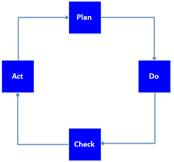 The cycle of scientific experimentation, used for example in pursuit of continuous improvement.
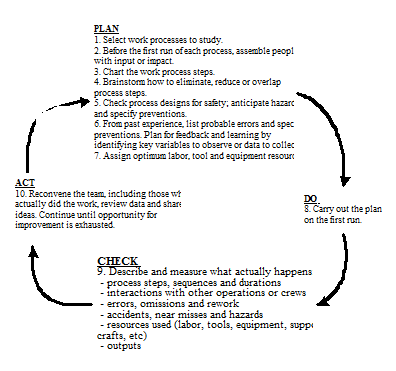
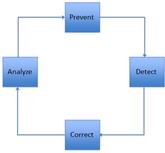 Reinterpretation of the PDCA cycle that fosters learning from experimentation, to fostering learning from breakdowns (Ballard 2014). An effective process for managing breakdowns does what can be done to Prevent breakdowns, Detects the occurrence of breakdowns that happen despite our best efforts–as close to the point of origin as possible; cleans up the mess, making sure to find and Correct any ripple effects; Analyzes why the breakdown occurred; and takes action to Prevent re-occurrence.