PARADE OF TRADES GAME
How Interdependence and Variability affect Project and Process Performance

What is the “Parade Game”?
The “Parade of Trades” Game — or simply Parade Game — Illustrates the impact of work flow variability on the performance of construction trades and their successors. Gus Sestrup, a superintendent with Turner Construction, coined the term “parade of trades” to describe how he plans to have trades follow one another through the project.
The game consists of simulating a construction process in which resources produced by one trade are prerequisite to work performed by the next trade. Production-level detail, describing resources being passed from one trade to the next, illustrates that variations in flow will cause a reduction in throughput, delay in project completion, and an increase in waste. The game shows that it is possible to reduce waste and shorten a project’s duration by reducing the variability in work flow between trades. Basic production management concepts are thus applied to construction management. They highlight two shortcomings of using the Critical Path Method (CPM) for field-level planning: (1) modeling the dependencies and frequent handoffs between trades or operations is unwieldy when using finish-to-start dependency links as one does when creating a CPM network, and (2) CPM schedules do not explicitly represent variability, yet the manifestation of variability leads to performance deterioration.
The Parade Game can be played in a classroom setting either by hand or using a computer; see the sections that follow. Computer simulation enables students to experiment with numerous alternatives in order to sharpen their intuition regarding variability, process throughput, buffers, productivity, and crew sizing. Managers interested in schedule compression will benefit from understanding work flow variability’s impact on succeeding trade performance.
Hands-on Game for Understanding Variability and Dependence
Background on the Game’s Development
Greg Howell enthusiastically hosted a first game session using the Parade of Trades at the 6th Annual Conference of the International Group for Lean Construction in Guarujá, Brazil. The Lean Construction Institute has also been using the Parade Game at many of their workshops to demonstrate the effects of variability and dependence on work flow.
Tommelein et al. (1998, 1999) studied the game and documented it in detail using the Stroboscope (Martinez 1996) computer-based discrete-event simulation software to run thousands of iterations in order to collect statistics and create interesting result plots. Alarcon and Ashley (1999) used @Risk (1997) to simulate a slightly modified dice game and analyzed its impact on project cost and schedule. More recently, Tommelein (2020) showed how a takt plan can be created for the Parade of Trades using swing capacity to increase plan reliability.
AGC’s curriculum on Lean Construction includes the Parade Game.
Read about the Parade Game aka. the Dice Game
Read about the fundamentals of the Parade Game:
- Tommelein, I.D., Riley, D., and Howell, G.A. (1998). “Parade Game: Impact of Work Flow Variability on Succeeding Trade Performance.” Proc. 6th Annual Conference of the International Group for Lean Construction (IGLC-6), 13-15 August held in Guaruja, Brazil, 14 pp., https://iglc.net/Papers/Details/58
- Tommelein, I.D., Riley, D., and Howell, G.A. (1999). “Parade Game: Impact of Work Flow Variability on Trade Performance.” ASCE, J. of Constr. Engrg. and Mgmt., 125 (5) Sept/Oct Issue, https://doi.org/10.1061/(ASCE)0733-9364(1999)125:5(304)
and gain deeper understanding of cost performance, and how to harness project and process variability and interdependence, in these papers:
- Alarcon, L.F. and Ashley, D.B. (1999). “Playing Games: Evaluating the Impact of Lean Production Strategies on Project Cost and Schedule.” Proc. 7th Annual Conference of the International Group for Lean Construction (IGLC07), 263-274, https://iglc.net/Papers/Details/60
- Tommelein, I.D. (2020). “Takting the Parade of Trades: Use of Capacity Buffers to Gain Work Flow Reliability.” In: Tommelein, I.D. and Daniel, E. (eds.). Proc. 28th Annual Conference of the International Group for Lean Construction (IGLC28), virtually in Berkeley, California, USA, https://doi.org/10.24928/2020/0076, online at iglc.net
What you need to Play the Parade Game
To play the Parade Game, you need the following:
- 5 to 7 participants
- 1 die
- 100 poker chips
- data collection sheets
Computer Game for Understanding Variability and Dependence
While conducting research on lean construction and new technologies for materials management, Professor Iris Tommelein studied the Parade Game using computer-based simulation. This work was funded by grant CMS-9622308 from the National Science Foundation, whose support is gratefully acknowledged. Any opinions, findings, conclusions, or recommendations expressed on this site are those of the authors and do not necessarily reflect the views of the National Science Foundation.
Game Download
We implemented the Parade Game as a Visual Basic application. That was more than 20 years ago, so the program is a bit old, but suprisingly it still works and we will be happy to share it with you. Not-for-profit educational use of this program is hereby granted provided you cite our journal paper (Tommelein et al. 1999) in any follow-on work you do related to the Parade. If the program is used in any money-making instructional, commercial, consulting, or other setting, written permission to do so must be obtained in advance of such use by contacting Professor Iris D. Tommelein.
Computer Game Instructions
Documentation of the computer-based Parade Game that was implemented in Visual Basic by Huyn Jeong (James) Choo, is written up in this paper that you can download:
- Choo, H.J. and Tommelein, I.D. (1999). “Parade of Trades: A Computer Game for Understanding Variability and Dependence.” Technical Report 99-1, Construction Engineering and Management Program, Civil and Environmental Engineering Department, University of California, Berkeley, September.
Please cite this paper when referencing the computer game described on this web page.
Playing the Parade Game on the Computer
The Parade of Trades computer program simulates a dice game. The purpose of this game is to demonstrate the impact variability and dependence have in a construction environment where multiple trades follow each other in a linear sequence and work output by one trade is handed off to the next trade.
Our program allows you to simulate the Parade Game on a computer. By automatically keeping track of the number of rolls (executions per trade), the number of outputs passed to the next trade, and the number of outputs in each buffer between trades, the program helps the user understand what impact variability and dependence may have on work flow.
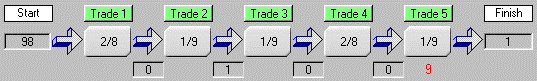
The rules of the Parade of Trades Game are here explained step by step. The figure below depicts an example of the status of the game at the start. It shows the capacity of each trade, that is, the maximum number of units of output they could produce in a given time unit. Half of the time, trades 1 and 4 can output 2 units, and the other half of the time, 8 units. Similarly, trades 2, 3, and 5 will half of the time output 1 or 9 units.

The Game is called a dice game because it is usually played with a blank die on which one number is written on three faces and another number on the other three faces. Rolling the die simulates the generation of random numbers. Players can make up their own game by writing any numbers on the faces of the die.
As determined by a roll of die 1, Trade 1 is able to output 2 units (shown in red). Since there are 100 units to be passed and all are readily available as input to trade 1, trade 1 is indeed able to hand over 2 units. This results in 2 units in buffer 1, which builds up between trades 1 and 2.

As determined by a roll of die 2, trade 2 is able to output 9 units (shown in red). Since only 2 units are available in buffer 1 as input to trade 2, trade 2 is able to hand over only 2 units. This results in 2 units in buffer 2. Clearly, the rule is that a trade can take from the buffer ahead of it only up to the total number available, irrespectively of the outcome of their roll, i.e., their capacity.

As determined by a roll of die 3, trade 3 is able to output 1 unit (shown in red). Since there are 2 units in buffer 2, trade 3 is able to hand over 1 unit, resulting in 1 unit in buffer 3.

As determined by a roll of die 4, trade 4 is able to output 8 units (shown in red). Since there is only 1 unit in buffer 3, trade 4 is able to hand over 1 unit, so there is one unit in buffer 4.

As determined by a roll of die 5, trade 5 is able to output 9 units (shown in red). Since there is only 1 unit in buffer 4, trade 5 is able to hand over only 1 unit, so 1 unit has been finished. A similar process continues until there are no units left to pass in any buffers, i.e., all 100 units have been finished.
Program Description
The figure below shows the main screen of the program. It is divided into three sections. The section above the bar graph is the input section. Five boxes connected by arrows represent five trades where trade 1 follows trade 2 and so on. It is assumed that 100 units of product are to be passed from the Start through the parade of trades to the Finish.

The numbers in each box represent the number of outputs each trade is able to produce in one time unit. The default value is 5/5, which indicates that the trade will always be able to output 5 units in one time unit. By clicking on the boxes, the user can change the numbers to preset choices (namely 4/6, 3/7, 2/8, 1/9) each of which has a 50/50 likelihood of occurring. Note that all these alternative pairs have an average of 5. For example, 4 * 50% + 6 * 50% = 5.

The user can assign any other numbers to describe the capacity of any trade by clicking on the corresponding “Trade 1”, “Trade 2”, “Trade 3”, “Trade 4”, or “Trade 5” button such as the one shown below.

Four control buttons are located on the main screen. The “Reset” button resets the data of the program, i.e., it returns the program to its initial status. The “Step” button allows the user to execute the rolling and passing process one step at a time and better see what is going on. Pressing the “Run” button will automatically perform the rolling and passing process until all 100 units are passed through the parade of trades. Pressing the “Chart” button allows the user to see a graph of the cumulative number of units passed (line of balance) and the buffer profiles (explained later). The “Exit” button allows the user to close the program.

Two options, “Seed” and “Time Delay”, can be set in the “Options” screen (shown on left) by selecting options from the menu bar. The seed drives the generation of random numbers in the simulation. By selecting a certain “Seed”, the user can predictably reproduce the outcome of a simulation. Changing the “Time Delay” allows the user to control the speed of simulation for automatic execution that occurs when the “Run” button is pressed. By pressing the button with upward pointing triangle, the user will return to the main screen.

Example Run
The following example will better explain the Parade of Trades program. The possible outcome for trade 1 and 4 is 2/8 and the possible outcome for trades 2, 3, and 5 is 1/9. The statistics after six rolls of the die for each trade are as shown below.
The “Number of Executions” line displays the number of executions performed by each trade and the sum of those numbers. The “Maximum in Buffers” line keeps track of the maximum number of units in each buffer. Buffer 1 refers to the buffer between trades 1 and 2, buffer 2 refers to the buffer between trades 2 and 3, and so on.
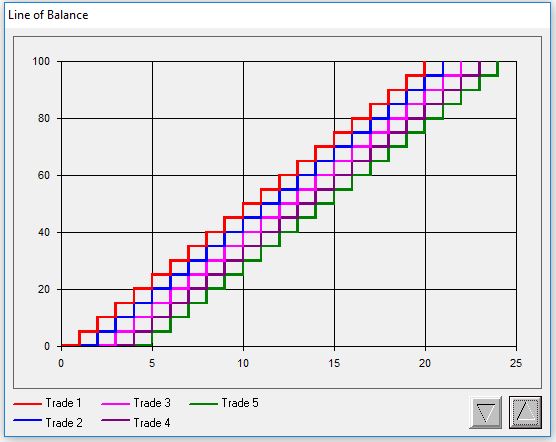
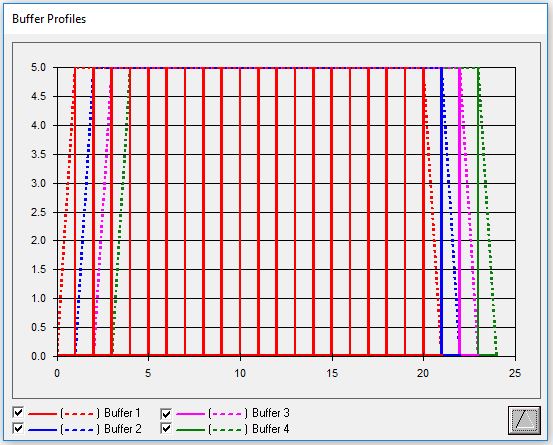
The graphs produced from the data generated during the simulation are depicted below. The first graph shows the cumulative total of the number of units passed also known as the Line of Balance. By comparing the steps of adjacent lines, the user can gauge the effect one trade’s productivity has on the next ones (note that the overall slope of the line decreases for downstream trades). The second graph shows the buffer profiles. The continuous line shows the build-up and depletion of the buffers, whereas the dashed line shows the maximum build-up of buffers.
Resources
Concepts and Terminology
Example Parades:
- Structural Parade: e.g., erecting structural steel (steel erector); placing and securing decking as well as welding shear studs (decking contractor); and placing rebar (rebar contractor), then pouring and finishing concrete (concrete contractor).
- Overhead Work Parade: e.g., installing a HVAC system (mechanical contractor), sprinkler system (fire protection contractor), emergency lighting (electrical contractor), and pipe (plumbing contractor).
- Perimeter Enclosure Parade: e.g., building perimeter walls, placing windows, installing flashing, and applying sealants.
- Interior Finishes Parade: e.g., installing wall studs, routing in-wall electrical conduit, placing insulation materials, hanging drywall, and painting.
Definitions (also see P2SL GLOSSARY):
- Production capacity: number of trade-specific work units per unit of time a crew is technically able to finish provided their work is unconstrained (i.e., directives, materials, tools, equipment, crew, workspace and suitable environmental conditions, and prerequisite work are available as needed).
- Production rate: actual number of trade-specific work units per unit of time a crew is able to finish given constraints on their work (e.g., lack of prerequisite work completed, non-availability of materials, or impeded workspace).
- Buffer (inventory buffer): work units accumulated ahead of a crew, from which they can draw at will to perform work.
- Wasted time: time during which a crew is not able to realize its production capacity due to constraints that hamper their work, which results in lost productivity.
- Project duration: time it takes from start to completion of a project.
- Throughput, throughput rate: number of work units completed divided by the project duration [units/time].
- Cycle time (CT): time it takes a product to go from beginning to end of a production process; i.e., the time it is Work-In-Process [time].
- Work-In-Process (WIP): number of units or quantities of materials or products between the start and end point of a production process; aka. WIP inventory. [units]
- InventoryStock on hand (e.g., materials or information), divided between:
- Raw materials inventory
- Work-In-Process (WIP) inventory, and
- Finished goods inventory
Inventory is a means to buffer a production system, by producing a product before the customer immediately downstream is ready for it. It is one of 7 wastes, referring to products or materials awaiting further processing before being ready for release as a finished good to a customer.
- Little’s Law: WIP = CT * TH
- Sequential finality: a predecessor activity or task being 100% complete (“final” or “done-done”) when its successor starts.
- To starve: being unable to perform a task due to lack of needed inputs.
- Input: the combination of directives, prerequisites, and resources needed to execute a process.
References
Alarcon, L.F. and Ashley, D.B. (1999). “Playing Games: Evaluating the Impact of Lean Production Strategies on Project Cost and Schedule.” Proc. 7th Annual Conf. of the Intl. Group for Lean Constr., IGLC-7, 26-28 July held at the Univ. of California, Berkeley, CA, pp. 263-273.
Choo, H.J. and Tommelein, I.D. (1999). “Parade of Trades: A Computer Game for Understanding Variability and Dependence.” Technical Report 99-1, Construction Engineering and Management Program, Civil and Environmental Engineering Department, University of California, Berkeley, September.
Martinez, J.C. (1996). STROBOSCOPE State and Resource Based Simulation of Construction Processes. PhD Dissertation, Civil & Envir. Engrg., Univ. of Michigan, Ann Arbor, MI, 518 pp.
@RISK (1997). Advanced Risk Analysis for Spreadsheets: User Manual. Palisade Corp., Newfield, New York.
Tommelein, I.D., Riley, D., and Howell, G.A. (1998). “Parade Game: Impact of Work Flow Variability on Succeeding Trade Performance.” Proc. 6th Annual Conference of the International Group for Lean Construction, IGLC-6, 13-15 August held in Guaruja, Brazil, 14 pp.
Tommelein, I.D., Riley, D., and Howell, G.A. (1999). “Parade Game: Impact of Work Flow Variability on Trade Performance.” ASCE, J. of Constr. Engrg. and Mgmt., 125 (5) Sept/Oct Issue, https://doi.org/10.1061/(ASCE)0733-9364(1999)125:5(304)
Last Updated 2024-02-13 P2SL